Average drinking water consumption per household in Bonaire was 153 cubic metres in 2024, but there are significant differences between neighbourhoods. Households in Sabadeco and Lima consume the most drinking water, on average. Rincon-North and Rincon-South have the lowest average consumption per household. This is according to figures from Statistics Netherlands (CBS).
The neighbourhood of Sabadeco had the highest average drinking water consumption per household in Bonaire in 2024, at 469 cubic metres. This is much higher than in other neighbourhoods on the island. Income appears to play a role here. Sabadeco also has the highest average disposable income per household.
Another reason that water consumption is higher in Sabadeco is that there are more swimming pools than average, and these are filled using drinking water. Households in Lima also use a relatively large amount of drinking water per household: 347 cubic metres on average. In Santa Barbara and Nawati North, drinking water consumption per household was much lower at 237 cubic metres and 223 cubic metres, respectively.
Lowest drinking water consumption in Rincon South
Drinking water consumption is lower in Rincon North and Rincon South than in many other parts of the island. In Rincon North, households use an average of 109 cubic metres of drinking water and in Rincon South average consumption is 106 cubic metres.
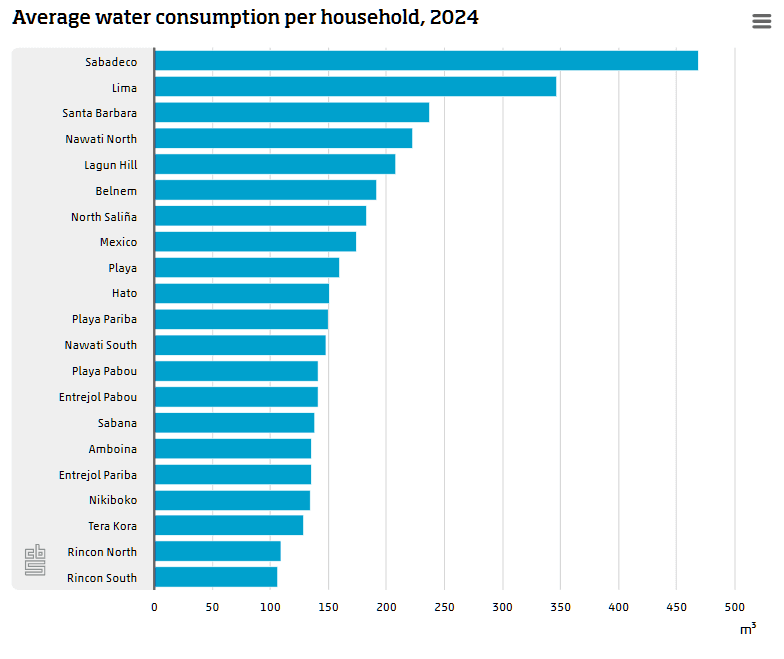
Image: © CBS
Higher drinking water consumption between April and October
Bonaire consumes the most drinking water between April and October. This is the period with the least rainfall and slightly warmer temperatures. Less drinking water is consumed between November and March.
In areas like Lima and, particularly in Sabadeco, the monthly differences in water consumption are larger. The other neighbourhoods have more stable water consumption per household throughout the year, with only a modest increase in the summer months.
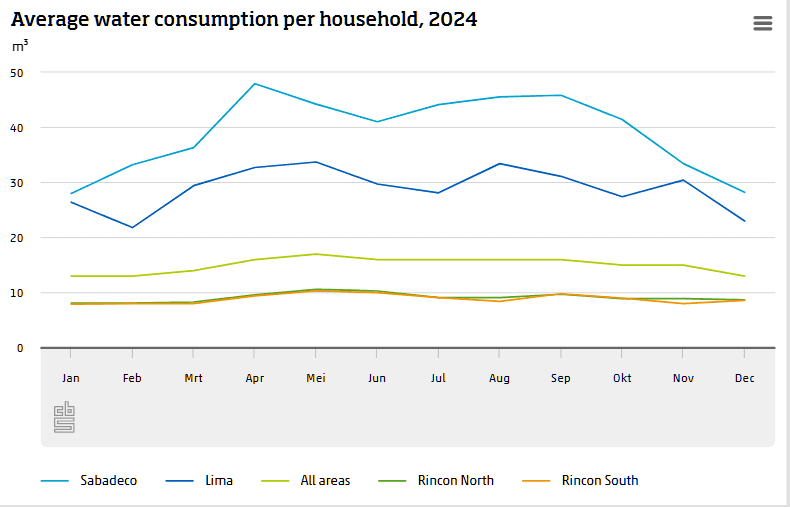
Image: © CBS
Water bills for households with lower drinking water consumption were lower in 2024
Households paid an average of US$57 per month for their drinking water in 2024. In Sabadeco and Lima, households paid an average of US$166 and US$124 per month for drinking water, respectively. This is because they consume more water than average.
In Rincon North and Rincon South, households spend an average of US$42 and US$41 on drinking water per month, the lowest anywhere on the island.
The total amount that households pay for drinking water is made up of fixed and variable costs. The fixed-cost component was reduced in 2024 thanks to funding provided by the Ministry of Infrastructure and Water Management as well as additional funding to boost purchasing power from the Ministry of Social Affairs and Employment. The variable-cost component of water bills actually increased.
Due to the funding provided to reduce the fixed costs, areas with lower drinking water consumption spent less on drinking water in 2024 than they did the year before, on average.
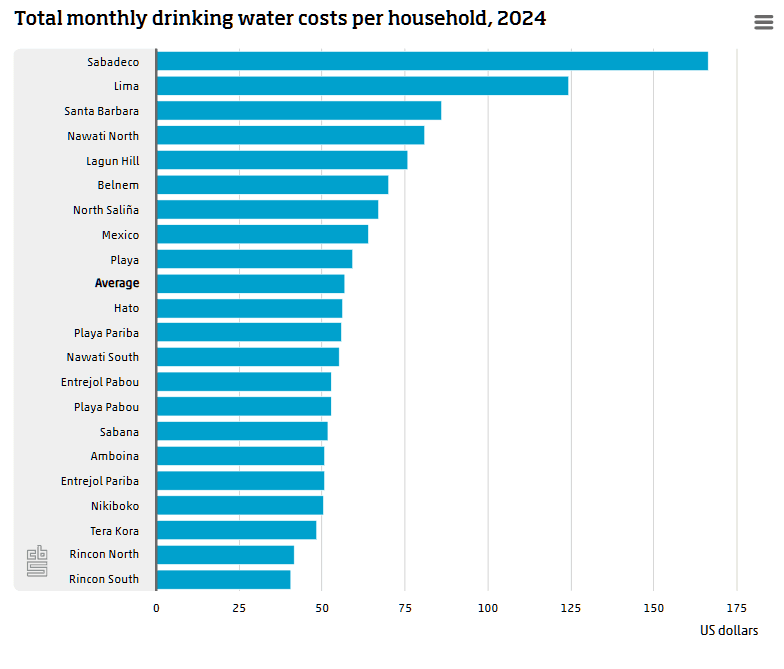
Image: © CBS
Sources
StatLine - Drinkwaterverbruik op Bonaire naar huishoudkenmerken, 2023-2024 - https://www.cbs.nl/nl-nl/maatwerk/2025/37/drinkwaterverbruik-op-bonaire-naar-huishoudkenmerken-2023-2024